Understanding the 123 Pattern in Trading: A Beginner’s Guide
Trading can often seem like an intimidating world filled with complex strategies and technical jargon. However, some indicators are simple yet effective, making them ideal for beginners. One such indicator is the “123 Pattern.” In this article, we will break down what the 123 Pattern is, how to identify it, and how you can use it in your trading.
What is the 123 Pattern?
The 123 Pattern is a trend reversal pattern that helps traders identify when the market is likely to change direction. It can be used in both bullish (upward) and bearish (downward) markets. This pattern consists of three points that form the foundation of the reversal:
- Point 1: This is the first peak or trough in the current trend. In an uptrend, Point 1 is the highest point reached before the price starts to decline. In a downtrend, Point 1 is the lowest point before the price starts to rise.
- Point 2: After reaching Point 1, the price retraces and forms a new low (in an uptrend) or high (in a downtrend). This point is crucial as it shows the first sign that the trend might be weakening.
- Point 3: The price attempts to move back in the direction of the original trend but fails to surpass Point 1, forming a lower high (in an uptrend) or a higher low (in a downtrend). This failure is a strong signal that the trend is likely to reverse.
How to Identify the 123 Pattern
To spot the 123 Pattern on a price chart, follow these steps:
- Locate the Trend: Begin by identifying whether the market is in an uptrend or a downtrend. You need a clearly defined trend to spot the 123 Pattern.
- Mark Point 1: Find the highest (in an uptrend) or lowest (in a downtrend) point on the chart, which will be your Point 1.
- Wait for Point 2: Look for a retracement where the price moves against the current trend, forming Point 2. This is the first sign that the trend might be weakening.
- Identify Point 3: Watch for the price to attempt a move back in the original trend’s direction. If it fails to break Point 1, it forms Point 3.
- Confirmation: Once Point 3 is confirmed, and the price starts moving in the direction of the new trend (opposite to the original trend), the 123 Pattern is considered complete.
Let’s look at an example of a 123 Pattern in both a bullish and bearish scenario.
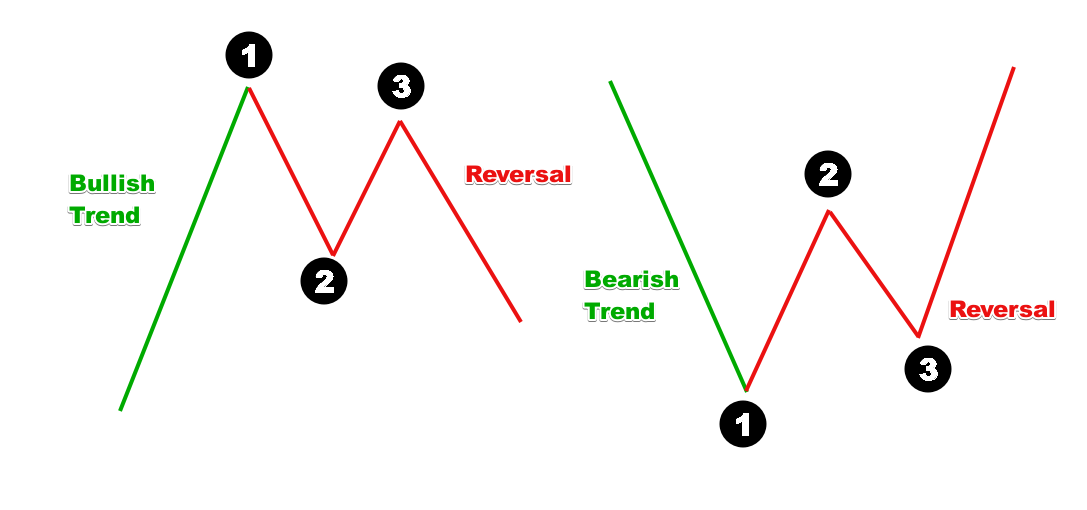
Example 1: Bullish 123 Pattern
Imagine the market is an uptrend. The price peaks at Point 1, then retraces to form a lower low at Point 2. The price attempts to rise again but fails to reach the high of Point 1, forming a lower high at Point 3. This indicates that the uptrend may be weakening, and a downtrend could be about to start.
Example 2: Bearish 123 Pattern
Conversely, consider a market in in a downtrend, with prices falling steadily. You notice that the price hits a low at Point 1, then retraces and forms a new high at Point 2. The price tries to move lower again but fails to reach the level of Point 1, forming a higher low at Point 3. This failure suggests that the downtrend might be ending, and a new uptrend could begin.
How to Trade the 123 Pattern
Once you’ve identified the 123 Pattern, trading it can be straightforward:
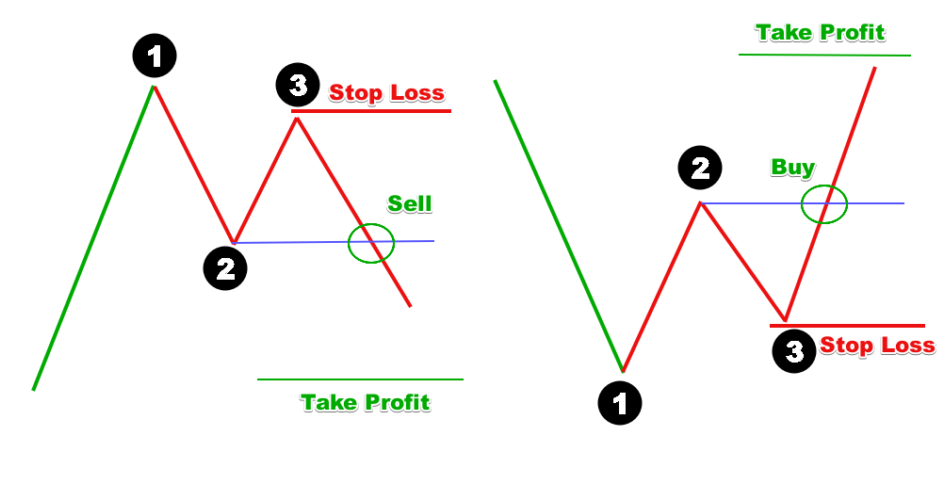
- Entry Point: Enter the trade after Point 3 is confirmed and the price moves in the new trend direction. For a bullish pattern, buy when the price moves above Point 2. For a bearish pattern, sell when the price moves below Point 2.
- Stop Loss: Place your stop loss just beyond Point 3 to protect yourself if the pattern fails. For a bullish trade, the stop loss goes below Point 3. For a bearish trade, it goes above Point 3.
- Take Profit: Set your take profit level based on the distance between Points 1 and 2. A common strategy is to aim for a reward that is at least twice the risk you are taking.
Conclusion
The 123 Pattern is a simple yet powerful tool for traders, especially beginners. It helps identify potential trend reversals, allowing you to enter the market at favorable points. By understanding how to spot and trade this pattern, you can add a valuable technique to your trading toolkit.
Remember, like all trading strategies, the 123 Pattern is not foolproof. It’s important to use it in conjunction with other analysis tools and risk management practices.