ASSET NAME: LSI Industries Inc.

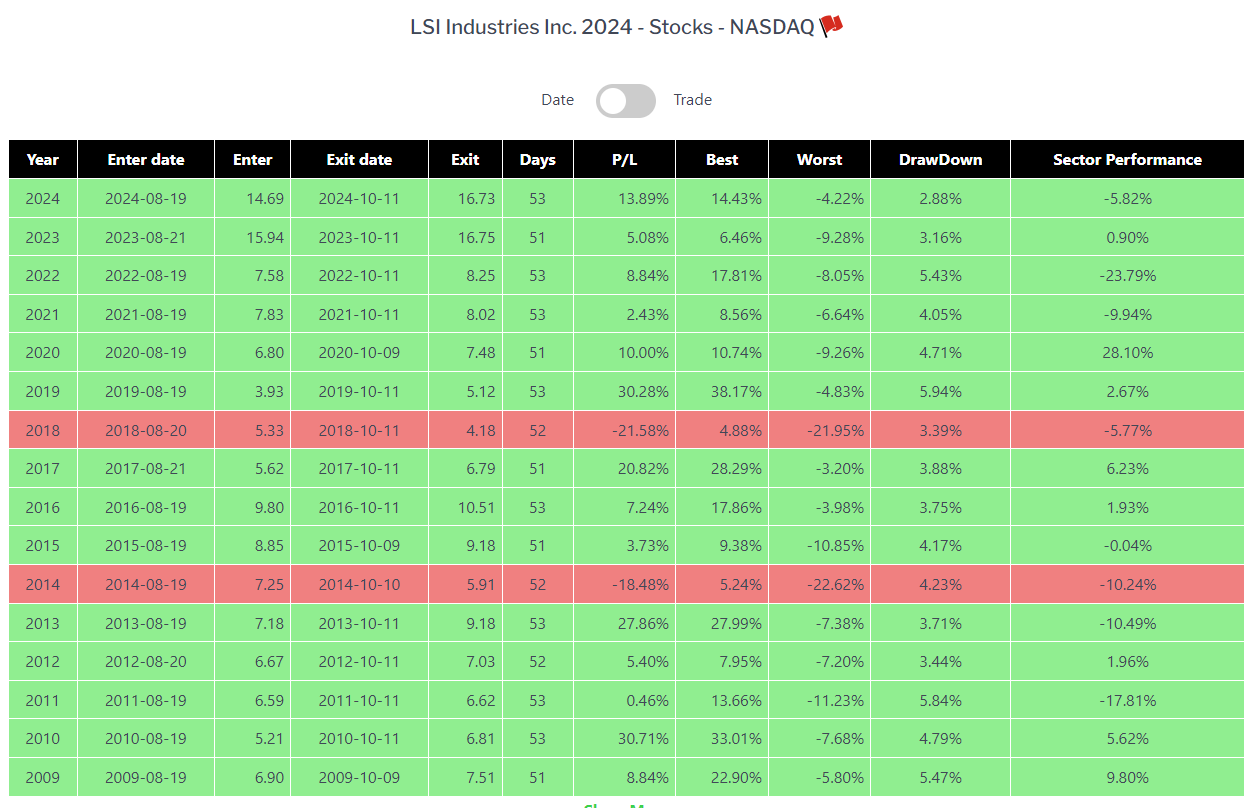
This strategy has been successful and, as can be seen from the chart, has largely replicated past results over the course of the trading period. Historical averages show a similar trend, with the difference that the five-year average has a stronger long direction since August.

The profit of +14% replicated past results. From the backtest we see that the average of the best is good, while the volatility deserves attention.

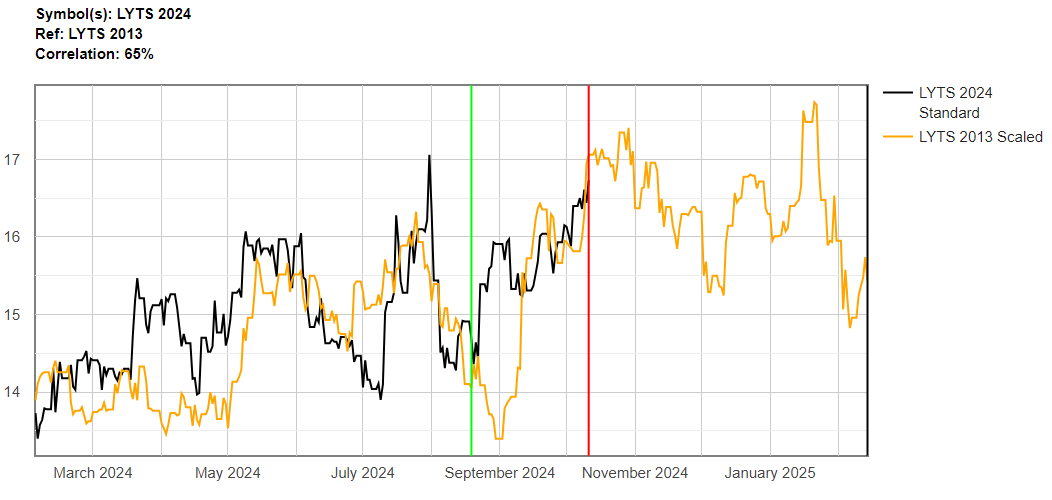
The 2013 trend shows correlations with the current one, with a clearly visible similarity from April to the entry date.
Conclusion
The strategy was presented with some very good seasonal indicators, the result replicates very well that of the past years, which is all we set out to achieve.
We always recommend you follow the evolution of the trend, its corrections or inversions that could give different indications than those we expect. Pay attention by checking the behavior of prices in the period preceding the entry date.
Notes
Free registration is required to analyze the trade with the interactive features.
Disclaimer
Past results and strategies published on Sayseason are provided for informational purposes only and are therefore not indicative and do not guarantee future results.