To verify if two patterns of the same asset but from different years exhibit a similar trend and can therefore be considered relevant in trading, you can follow these steps:
Identify the Patterns
First, clearly define the patterns you are comparing. Ensure they belong to the same asset and are from the different years you’re analyzing.
Overlay the Charts
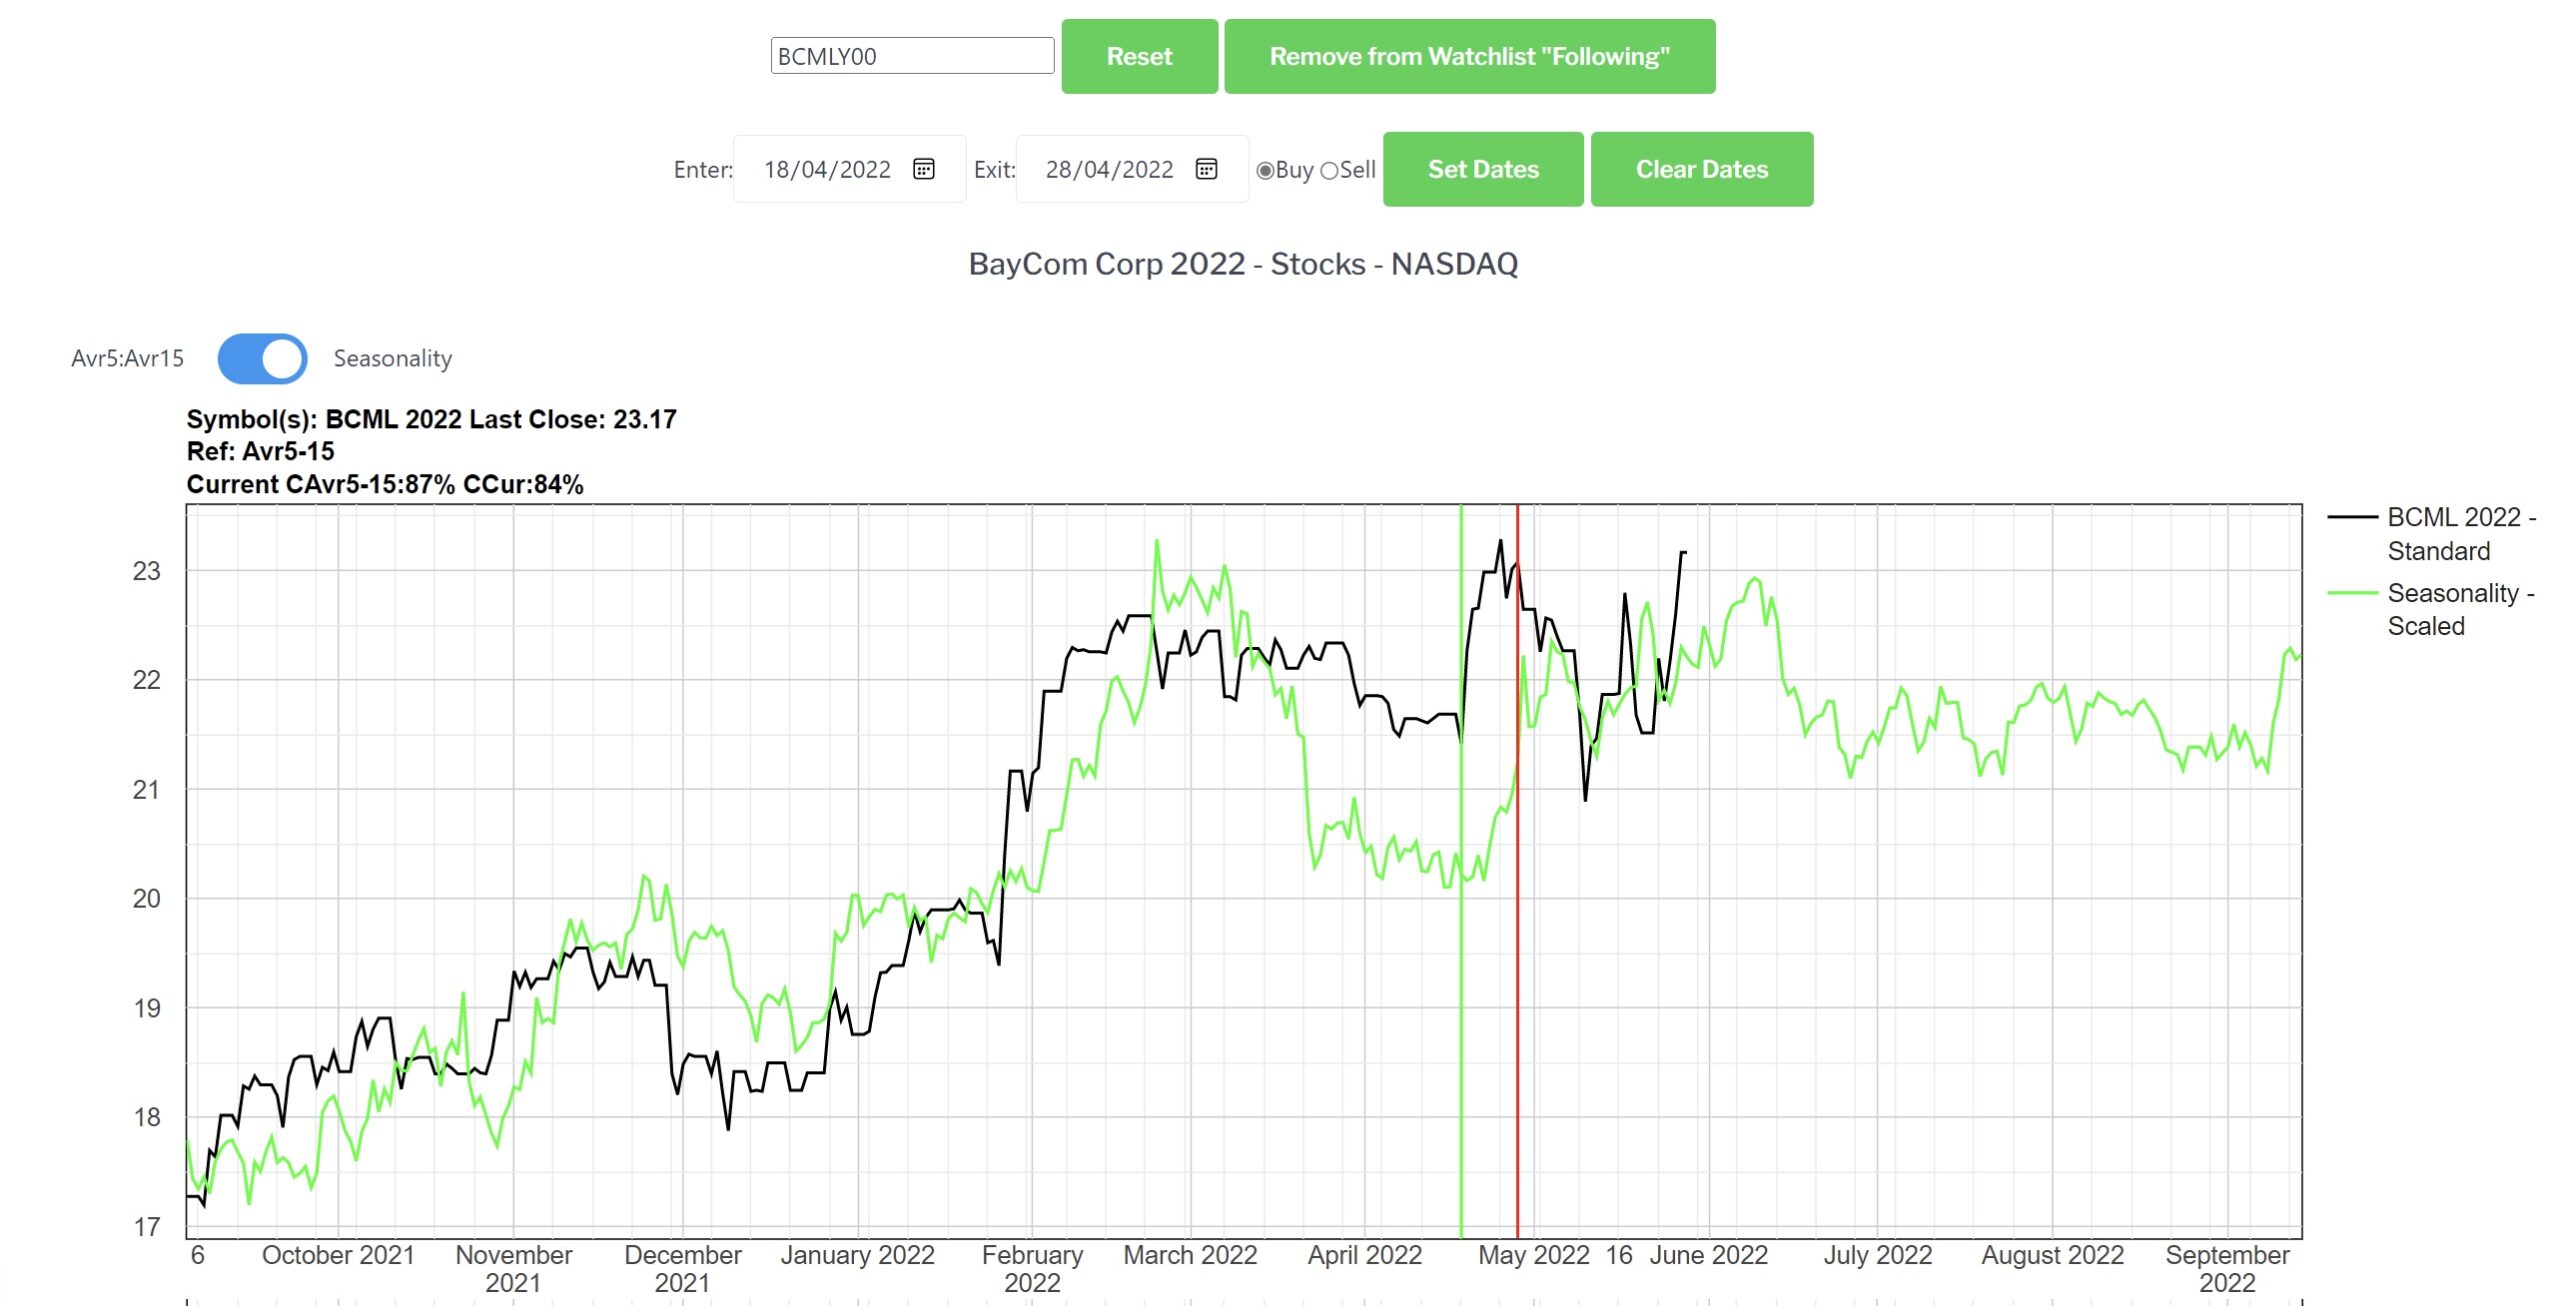
Start by comparing the price charts of the stock for the specific periods in each year. You can manually overlay the charts to see how the price movements align. Look for similarities in the shape of the price action, such as peaks, valleys, and the overall trajectory of the trend.
Normalize the Data
Since the patterns are from different time periods, the price scales might differ. Normalize the data by adjusting for differences in price levels, volatility, or time frames, making the patterns more comparable.
Timeframe Matching
Select the Same Timeframes: ensure that you are comparing the same timeframes (e.g., daily, weekly, or monthly) for both years. This consistency is crucial for an accurate comparison. Look at how the stock behaved over a similar period (e.g., Q1 of each year) and identify if the timing and duration of movements are comparable.
Check for Recurring Events
Analyze External Factors: consider any external events or fundamental reasons that might have driven the price movements in both years. If similar events (like earnings reports, economic data releases, or seasonal factors) influenced the stock in both years, the trends might be similar due to these recurring catalysts.
Evaluate Market Context
Consider the Broader Market Environment: assess the overall market conditions during both periods. If the general market environment (bullish, bearish, or neutral) was similar in both years, it could explain why the stock followed a comparable trend.
Sector Performance
Look at how the sector in which the stock operates performed during both periods. A similar performance in the sector could indicate a similar trend in the stock.
Backtesting
Conduct a backtest using the identified patterns on historical data. This will help you understand if the patterns consistently lead to similar results.
Trade Simulation
Imagine placing trades based on the patterns you observe in the past. If the outcome (profit or loss) is similar for both periods when applying the same trading logic, it reinforces the similarity of the trends.
Conclusion
By following these steps, you can effectively compare the trends of two patterns from different years for the same stock, even without relying on technical indicators. The key is to focus on visual analysis, historical context, and the behavior of the price action. If you find strong similarities in the trends, it can be a valuable indication that the pattern might repeat, and you can consider it in your trading strategy.